Dungeons and Dragons: Online
My work on DDO! I've organized this into patch notes.
I am an experienced Game Systems Designer, with AAA RPG and Live Service experience. This is my portfolio!
My work on DDO! I've organized this into patch notes.

An unannounced AAA RPG built using Unreal Engine.
I was a Senior Systems Designer on this project, and also contributed to some level design.
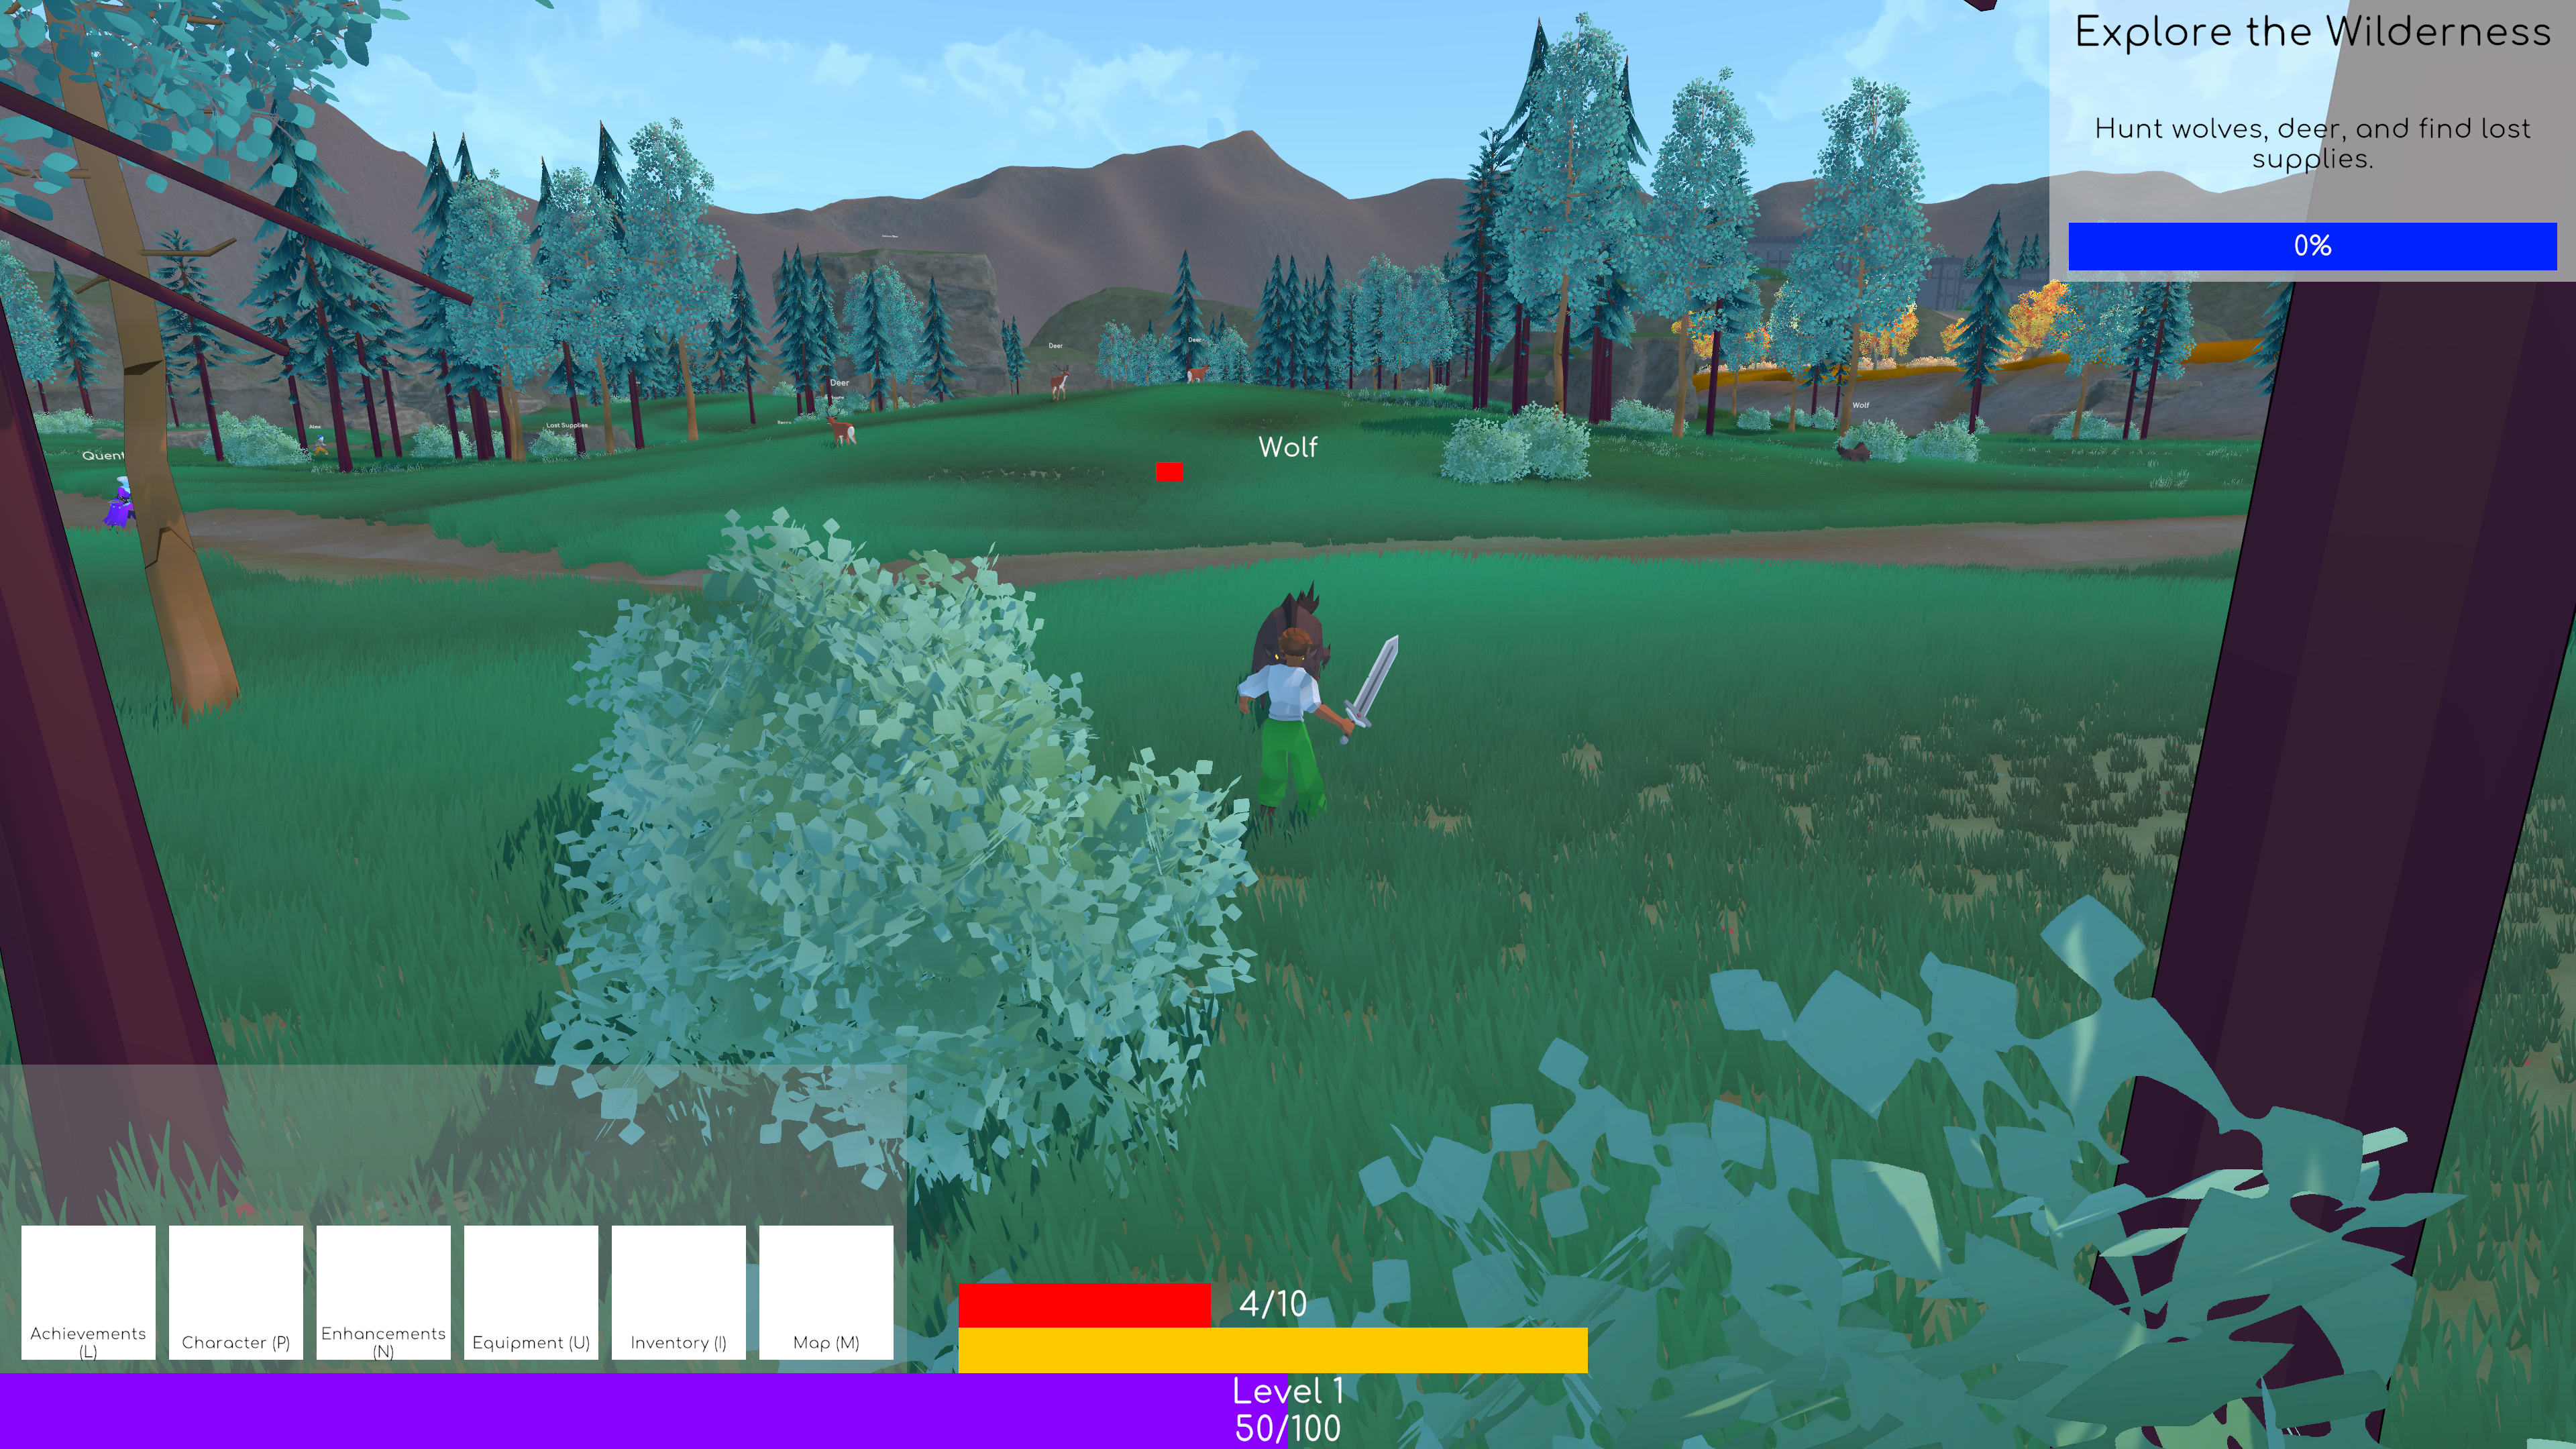
Something I've been cooking up in Unity in my spare time: an indie solo project meant to simulate a MMORPG as a single-player experience.
Includes a playable demo!
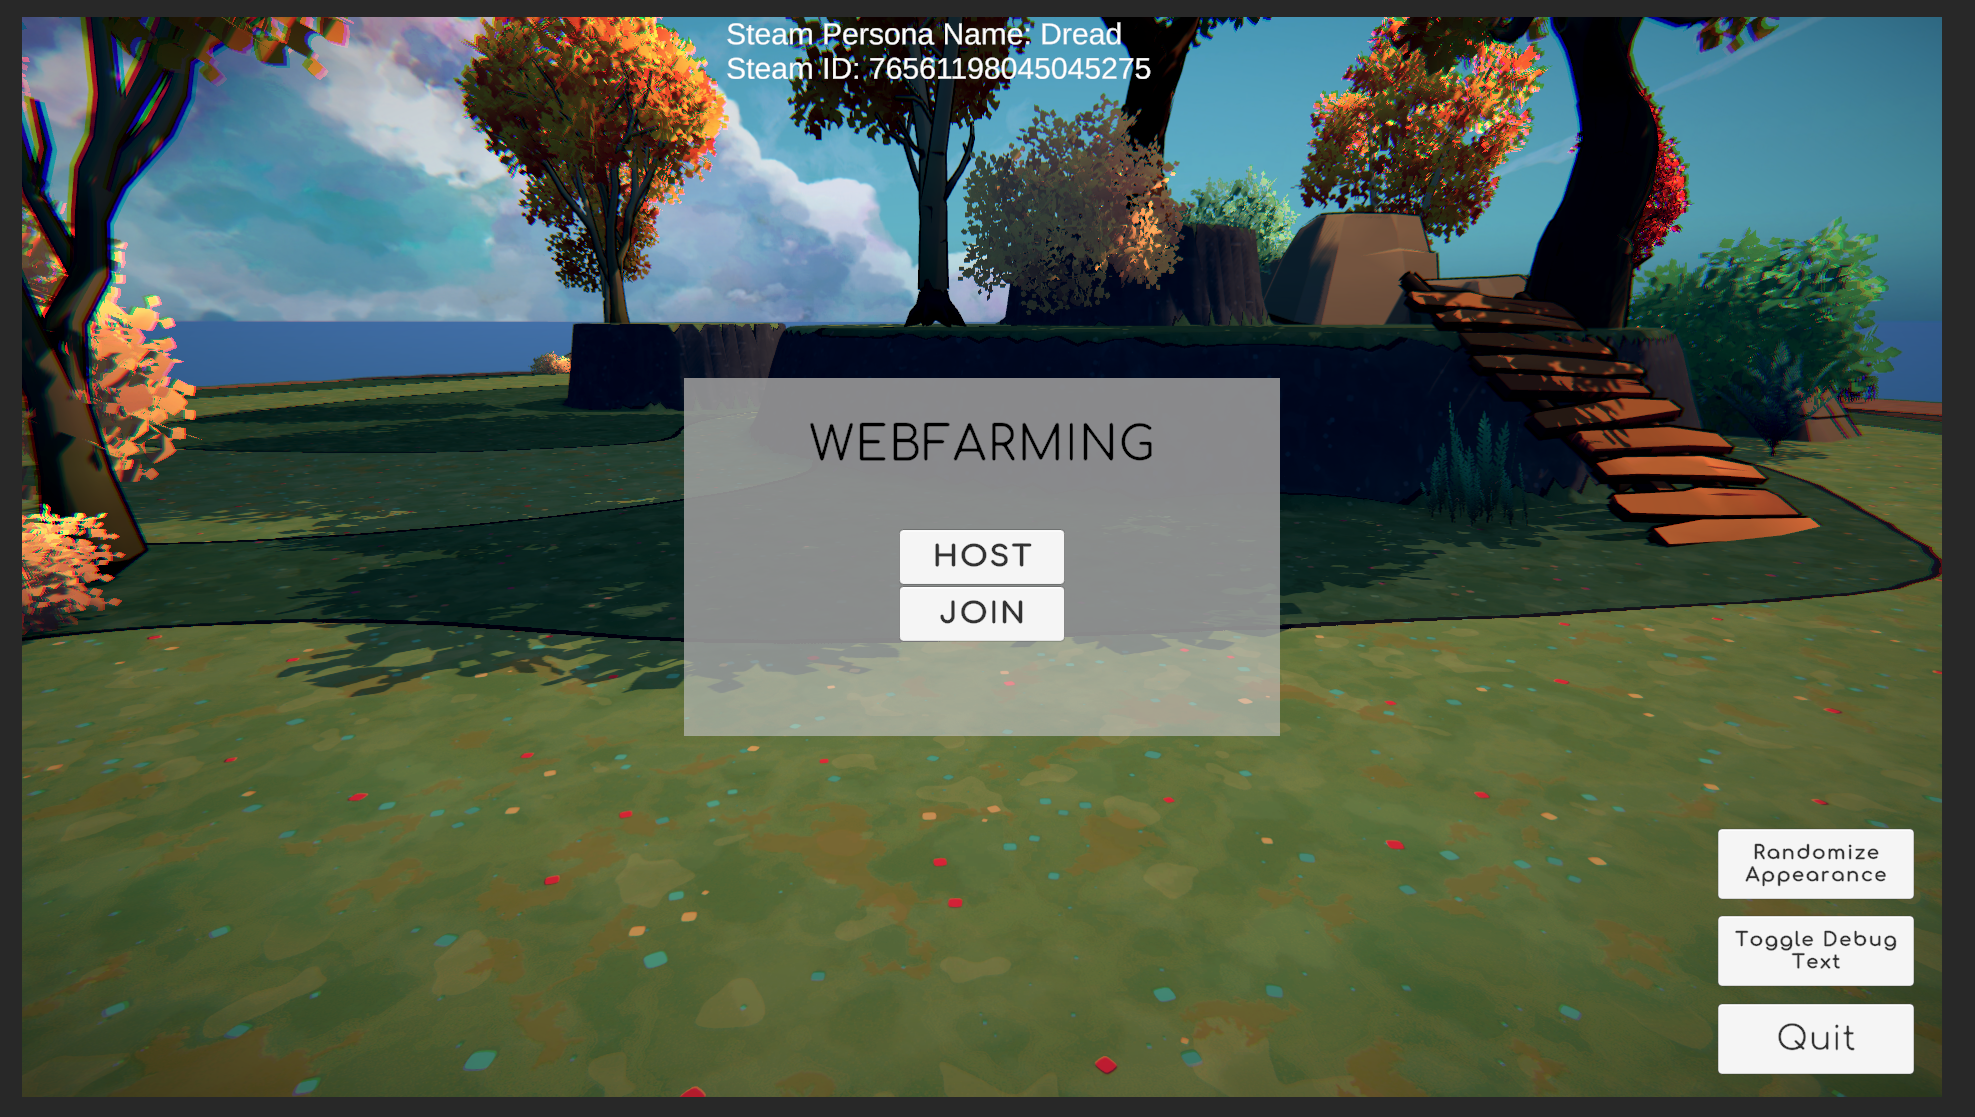
An online game meant to bring people together. Features Mirror Networking and the Steam API.
Includes a playable demo!
A GW2 REST API endpoint, featuring fun graphs and statistical analysis.
Tracks achievement progress, dye progress, legendaries, fractals, and more!
Requires a valid GW2 API key to view. If you need to borrow mine, let me know!